Basics
Features
Security
Administration
Command Line Interfaces
- Introduction
- repliadm
- repliadm coordinator
- repliadm validate
- repliadm versions
- replictl
- replictl action
- replictl apply
- replictl cluster
- replictl context
Orchestrator Action Reference
API Reference
Upgrades
Scaling
Events
Before you can react to a change in the system you need to know that something has changed.
Replicante’s first task is to observe all nodes and generate events to reflect changes to nodes and clusters. These events are internally used to drive features but are also recoded for users to see.
Having access to historical events can provide valuable insight:
- Was the datastore down or in the middle of a failover when increased error rates was reported?
- Did something unexpected happen after a configuration change?
Being able to correlate datastore events with application errors, performance issues, or other unusual activity is key into improving your services and products.
WebUI history view
The simplest way to view the events history is to check out the Events page in the WebUI.
Stream subscription
Observed and generated events are emitted onto a stream.
Events order is guaranteed for events in the same cluster but events from different clusters can be interleaved in any order. System events order is also guaranteed with respect to other system events but not to cluster events.
The stream of events acts as the source of information for most of the system and drives the actions subsystem. Both causes and effects of system state changes will be reflected in this stream.
On top of being a foundation for Replicante itself, the use of an events stream means that external systems can be designed to follow (or subscribe to) the stream to be notified of events as they occur.
Such powerful extension point opens the system up for almost endless integrations. To name just a few:
- Send notifications when events occur.
- Trigger custom automated actions and verify their results.
- Collect context useful for possible Root Cause Analysis or other reporting.
- And much much more …
Snapshot events
Replicante periodically emits a special kind of event to describe the current state of an entity.
Since Replicante monitors distributed systems it is not possible to consistently provide a point in time view of monitored clusters. It is on the other hand possible to observe individual parts of the cluster state consistently.
These SNAPSHOT_* events each describe a different part of the system at a different point in time.
External systems can make use of these snapshot events to synchronise their state with the observed
state of the cluster and compensate for missing events or other errors.
Event snapshots can be disabled by setting the events.snapshots.enabled option to false.
This feature is enabled by default.
The
events.snapshots.frequencyconfiguration options controls how often snapshots should be emitted.The system does not currently guarantee an upper bound to the time between intervals.
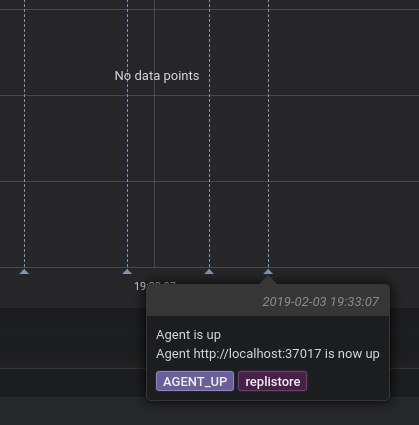
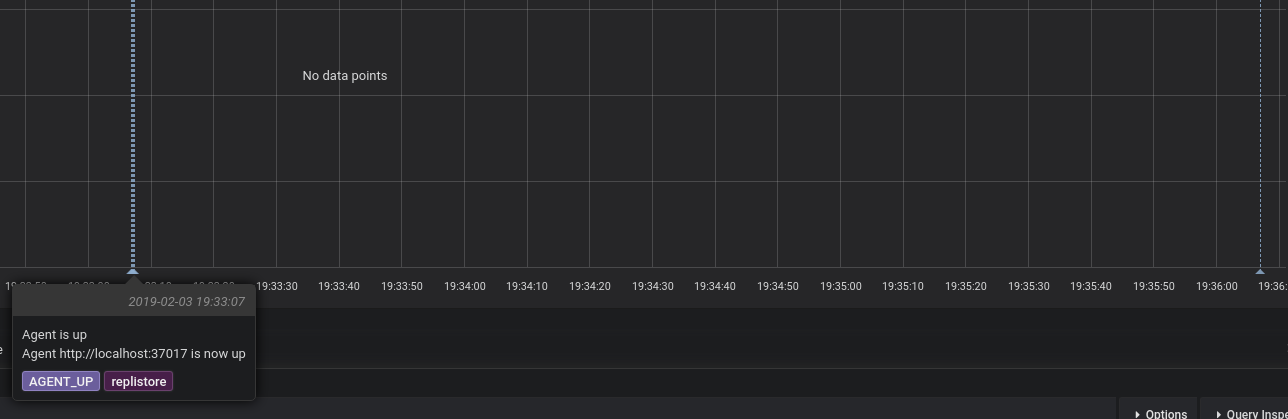
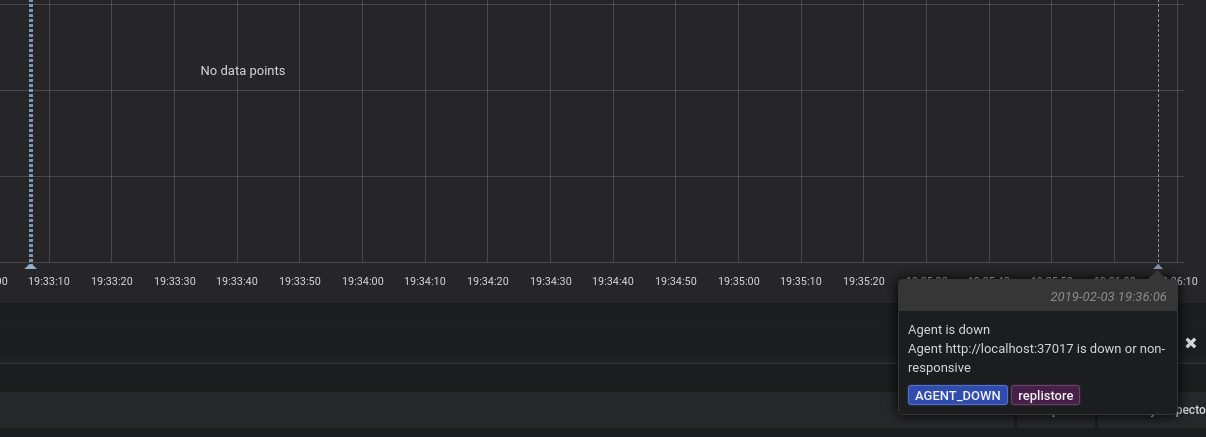
Grafana annotations
Building on the events stream mentioned above, Replicante Core offers Grafana annotations integration!
This feature requires the Grafana component to be enabled enabled
(components.grafana configuration option; enabled by default).
A set of endpoints compatible with the
simple JSON datasource
is available under the /api/unstable/grafana root.
Grafana configuration
The annotations integration mainly provide a specialised query interface to stored events so most of the configuration is on the Grafana side:
- Install the simple JSON datasource plugin if not already installed.
- Configure a new
Simple JSONdatasource to point tohttp://REPLICANTE_HOST:REPLICANTE_PORT/api/unstable/grafanaif not already available. - On a dashboard, configure a new annotation query using the newly created datesource.
- (Optional) Filter events by adding JSON encoded filters as the query text.
Annotation filters
By default, the first 1000 non-SNAPSHOT_* events in the queried interval are returned.
The following filters can be used to change what is returned:
cluster_id: (string) filter events by originating cluster ID.event: (string) filter events by event type.exclude_snapshots: (true|false) excludeSNAPSHOT_*events.exclude_system_events: (true|false) exclude events not originating from a cluster.limit: (integer) maximum number of events to return.